The challenge

The global pandemic forced many businesses, including contact centres, to send their staff home to work.
Contact Centre leaders faced massive challenges, since they relied on their physical presence to see and respond to what was happening. Now they are “flying blind”. They have to see and fix problems when they, their agents and IT support staff all work from home.
Now, reports are needed more than ever, not to analyse performance over time, but to allow supervisors to see what is going on and take appropriate action.
In the on-premises paradigm, the supervisor was like a battlefield commander who would see a problem and move to that point to solve it. Now she is more like an air traffic controller, reports are her radar which she needs to control the aircraft in her patch of sky.
How Omningage Connect’s reports meet that challenge?
Omningage Connect has three layers of user access. The highest is the Administration Application, below this is the Supervisor’s desktop and the lowest is the Agent Desktop. Each has its own reports.
Reports in the Administration Application
This level has the most reports. They give users situational awareness of operational performance, how the contact Centre meets the demand from inbound calls, e-mails and chats. Users gain an awareness of agent behavior, which contributes to the team’s operational success and customer satisfaction.
“Voice” reports

There is a list of the calls which have been handled. It can be searched and sorted to reveal calls by various parameters.
There is also a list of calls where First Contact Resolution (FCR) has not been achieved. This helps supervisors troubleshoot situations where customers are not getting their requests handled. Where a specific queue comes up more frequently, the issue may be related to a specific product or service. Where agent names come up, there may be a training issue. Where non FCR calls are very short, agents may be hanging up or responding with silence to get themselves a few seconds of unsanctioned breaks.
“Queue” reports
These show the standard KPIs related to specific queues. This is where benchmarks are defined at the Queue level. The supervisor can establish what is “normal” to trouble when it is brewing.
“Wrap up & tags” reports
Users can see which wrap up codes and tags are being applied to calls, chats and e-mails. Users can get a sense of what the “normal” distribution of wrap up codes and tags should be.
When situations change, users see this immediately and react quickly to find out what is going wrong and fix the problem, even when working from home.

“Agent” reports
These show average KPI data for agents between two dates. Comparing these with benchmarks can help users to see which agents are under performing. Filtering by date range, users can see if this is a neglected persistent problem, or a recent problem which will be solved with corrective coaching.
Reports on the Supervisor Desktop
Supervisors are the interface between the company and the agent. They usually “fight the fires” and solve unexpected crises such an unexpected surge in call volumes or agent absences.
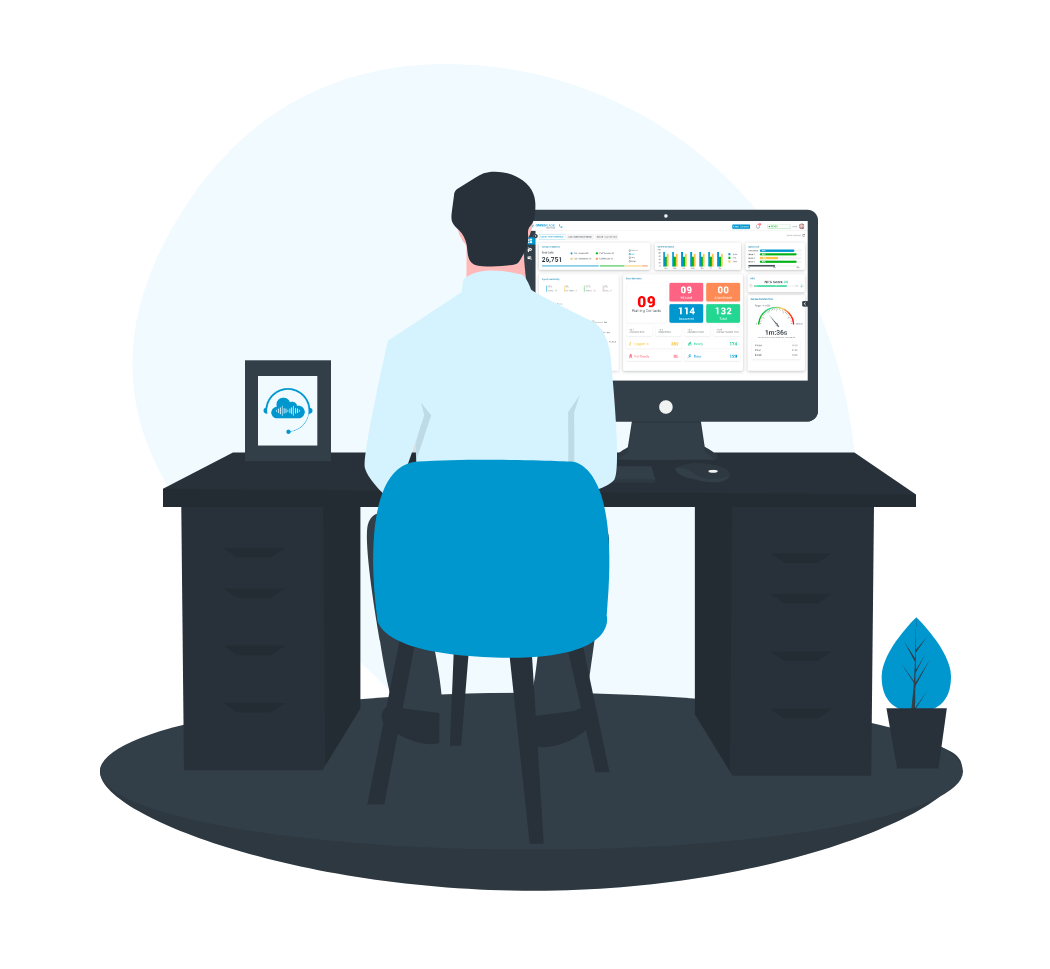
“Performance” dashboard

Supervisor have a near real time view of Service Level at contact Centre and queue level. Supervisors can see how well the team copes with the flow of calls, chats and e-mails.
Supervisors have a report showing how many agents are in each call state. If a queue shows service level issues, they can check on the same dashboard how many agents are logged in, ready, not ready or busy. They can also see Average Handling Time and Hold Time to check the obvious root causes.
The same dashboard also has a pie chart report showing wrap up codes used. This will shows if there is something unusual going on which might affect Service level and Average Handling Time.
“Queue statistics” report
The user can see real time statistics for each queue. They show the number of callers, and its root causes, the length of the longest call in each queue, the numbers of agents who are ready and not ready and the average answer time. Users find out quickly what is happening in each queue and why.
“Team monitoring” report
This report gives a real time report of the state of each agent in the contact Centre. Supervisors can see who is and is not ready and how long they have been in this situation. Users can prioritize their attention to have the maximum effect.
Reports on the Agent Desktop
The agent desktop includes a dashboard with reports showing the agent’s service level, contact statistics, personal availability logged and customer sentiment.
The agent can see how well she is doing in terms of operational efficiency and what the customers think of their work.
The agent has the data to take responsibility for her own performance and partly relieving the supervisor of the burden. She can see how she affects her own numbers. She can be given targets to meet and be incentivized on.

Wrap up
Technology is still no substitute for leadership. Omningage Connect enables good leaders with tools to improve their situational awareness and make more effective decisions, even when everybody is working from home.